Tuesday, October 6, 2020

Inflation Convergence over Time: Sector-Level Evidence within Europe


Inflation Convergence over Time: Sector-Level Evidence within Europe


One sentence summary: Average half-life of inflation differentials across European countries has decreased from about 15 months to about 8 months within the last two decades.

The corresponding academic paper by Hakan Yilmazkuday has been accepted for publication at International Finance.

Working paper version is available here.

 
Abstract

This paper investigates inflation convergence among European countries by using sector-level data for the period between 1997:M1 and 2019:M12. Panel unit root tests at the country-sector level are conducted by using moving windows, which is useful to analyze changes in inflation convergence and the corresponding speed of convergence over time. The results suggest evidence for inflation convergence for the majority of sectors within Europe, although disruptions have been experienced by certain countries, especially during the 2008 financial crisis. Regarding the speed of inflation convergence, the average half-life across European countries has decreased from about 15 months to about 8 months during the sample period. Important sector-level implications follow for European Union (EU) candidate countries and non-euro EU member countries regarding the Maastricht Treaty.


Non-technical Summary
Inflation convergence is one of the important criteria in the Maastricht Treaty to ensure price stability and integration within the European Union (EU). This criterion not only requires member countries to have a high degree of price stability but also calls for a price performance that is sustainable for the adoption and continuous circulation of euro. Accordingly, when candidate countries are considered for EU membership or the Euro Area (EA), part of the evaluation is achieved through inflation convergence. Moreover, even when a country is an EU member or within EA, its performance of price stability is evaluated over time for sustainability. It is implied that an investigation of inflation convergence within Europe over time is essential for the price stability and continuous integration of EU.

This paper achieves such a time-varying investigation for inflation convergence among European countries. The formal analysis is conducted by using four-digit sector-level inflation data from 34 countries covering the monthly period between 1997:M1-2019:M12, where five year (i.e., sixty months) moving windows are considered to have a time-varying investigation. Panel unit root tests are used to investigate the convergence of inflation rates at the country-sector level. In particular, country-sector specific panel estimations are achieved by comparing sector-level inflation rates of each country with those of other countries within Europe; i.e., the cross-sectional dimension of the panel unit root tests consist of countries at the sector level.

Having a sector-level investigation is essential to avoid any aggregation bias. This type of an investigation is also useful to obtain sector-specific policy implications, especially for EU candidate countries and non-euro EU member countries, as such an investigation can reveal the sectors that are responsible for non-convergence (if any). Moreover, different from country-level analyses where evidence for only convergence versus non-convergence can be obtained, having a sector-level investigation results in obtaining information on the total expenditure share of sectors for which there is evidence for inflation convergence.
 
When there is evidence for convergence (if any) for a particular sector in a particular country, the corresponding speed of convergence is further investigated; this is convenient to observe how the speed of convergence has changed over time at the country-sector level. The corresponding results show that inflation convergence is achieved for all sectors in several countries for most of the sample period, although the total expenditure share of sectors experiencing convergence is as low as about 75% across countries.
 
Once estimations are achieved at the country-sector level, the corresponding results are further aggregated across sectors (of each country) to have country-specific results for inflation convergence. These country-specific results suggest that there is evidence for stability over time for most countries except for certain time periods that mostly coincide with the 2008 financial crisis. In particular, countries such as Bulgaria, Estonia, France, Ireland, Iceland, Lithuania, Latvia and United Kingdom have experienced disruptions in their sector-level inflation convergence processes during the 2008 financial crisis, whereas countries such as Switzerland, Hungary, Italy, Poland, Slovakia and especially Turkey have experienced disruptions in their sector-level inflation convergence processes starting from around 2015. Regarding the speed of convergence, the average half life across countries has decreased from about 15 months between 1997:M1-2001:M12 to about 8 months between 2015:M1-2019:M12.
 

Sector-level half-life estimates for the median country suggest that before the official circulation of the euro (i.e., between 1997:M1 and 2001:M12), half-life estimates have an average (across sectors) of about 17 months, with a range between 10 months (for "food and non-alcoholic beverages") and 26 months (for "restaurants and accommodation services"). By the latest period of 2015:M1-2019:M12, the average half-life estimate (across sectors) have reduced to about 11 months, with a range between 5 months (for "clothing and footwear") and 35 months (for "restaurants and accommodation services"). 
 
 
It is implied that especially "restaurants and accommodation services" is responsible for not having any further reductions in half-life estimates over time; as indicated in earlier studies, this can be fixed by having more labor mobility across countries, product diversification and trade openness.
 

The corresponding academic paper by Hakan Yilmazkuday has been accepted for publication at International Finance.

Working paper version is available here.


Thursday, September 3, 2020

Fighting Against COVID-19 Requires Wearing a Face Mask by Not Some but All


Fighting Against COVID-19 Requires Wearing a Face Mask by Not Some but All


One sentence summary: Causal effects of social interaction on COVID-19 are statistically eliminated when more than 85% of people "always" wear a face mask.

The corresponding academic paper by Hakan Yilmazkuday has been accepted for publication at Transportation Research Interdisciplinary Perspectives.

is available as a working paper here.

 
Abstract

This paper investigates the effects of wearing a face mask on fighting against coronavirus disease 2019 (COVID-19). The formal analysis is achieved by using a difference-in-difference design, where U.S. county-level data on changes in COVID-19 cases or deaths are regressed on lagged changes in social interaction of people measured by Google mobility. The main contribution is achieved by distinguishing between the effects of social interaction on COVID-19 in mask-wearing versus non-mask-wearing counties determined by Dynata surveys. After controlling for county-specific and time-specific factors, the results show that social interaction causally increases both COVID-19 cases and deaths across U.S. counties. Wearing a face mask starts working to fight against COVID-19 only if more than 75% of people in a county "always" wear a face mask, while the effects of social interaction on COVID-19 are statistically eliminated when more than 85% of people in a county "always" wear a face mask.

  
Non-technical Summary
Social interaction between people is accepted as one of the key determinants for the spread of viruses leading to infections, including coronavirus disease 2019 (COVID-19). Despite its leading effects on COVID-19, social interaction is still necessary to prevent the corresponding societal and economic costs. Accordingly, wearing a face mask in public has been suggested by several studies to be able to continue having social interactions during the COVID-19 era as mask wearing reduces the transmissibility per contact by reducing transmission of infected droplets in both laboratory and clinical contexts.
 
Despite the consistency in the recommendation that especially symptomatic individuals should use face masks, discrepancies have been observed in the general public and community settings regarding face-mask wearing. Accordingly, this paper investigates the effects of wearing a face mask on the causal relationship between social interaction and COVID-19 cases or deaths. This initially requires confirming the causal relationship between social interaction and COVID-19 cases or deaths. This confirmation is achieved by using daily data from U.S. counties on COVID-19 cases or deaths as well as social interaction measures based on Google mobility for the period between February 15th, 2020 and August 30th, 2020. The formal analysis is achieved by using a difference-in-difference design, where U.S. county-level data on changes in COVID-19 cases or deaths are regressed on lagged changes in social interaction of people after controlling for county-specific and time-specific factors. The results of this initial investigation confirm that higher social interaction leads to higher COVID-19 cases and deaths across U.S. counties.
 
After confirming the causal relationship between social interaction and COVID-19 cases (or deaths), we continue with a secondary investigation regarding the effects of wearing a face mask on this relationship. In order to do so, we categorize U.S. counties as mask-wearing counties versus non-mask-wearing counties by using Mask-Wearing Survey Data collected by Dynata at the request of New York Times from 250,000 survey respondents. This categorization of U.S. counties results in splitting the effects of social interaction on COVID-19 cases/deaths into those in mask-wearing counties versus non-mask-wearing counties.
 
 
The results of this secondary investigation reveal that wearing a face mask starts working to fight against COVID-19 cases or deaths only if more than 75% of people in a county "always" wear a face mask, while the effects of social interaction on COVID-19 are statistically eliminated when more than 85% of people in a county "always" wear a face mask. Therefore, it is possible to continue having social interactions without any statistically significant effects on COVID-19 cases if a community-wide wearing of face masks can be achieved. This result is important as it provides insights about how societal and economic costs due to COVID-19 can be prevented by wearing a face mask by not some but all.

The corresponding academic paper by Hakan Yilmazkuday is available as a working paper here.

Wednesday, July 22, 2020

Changes in Consumption in the Early COVID-19 Era: Zip-Code Level Evidence from the U.S.


Changes in Consumption in the Early COVID-19 Era: Zip-Code Level Evidence from the U.S.


One sentence summary: Spending on goods and services that can (cannot) be consumed at home has increased (decreased) amid COVID-19.

The corresponding academic paper by Hakan Yilmazkuday has been accepted for publication at Journal of Risk and Financial Management.
 
The working paper version is available here.

 
Abstract
Using monthly zip-code level data on credit card transactions covering 16 U.S. cities, this paper investigates changes in consumption at local commercial places during the early coronavirus disease 2019 (COVID-19) era. Since using aggregate-level data can suppress valuable information on consumption patterns coming from zip codes, the main contribution is achieved by estimating common factors across zip codes that are controlled for factors that are zip-code and time specific as well as those that are zip-code and sector specific. The estimation results based on common factors across zip codes show that relative consumption of products and services that can be consumed at home (e.g., grocery, pharmacy, home maintenance) has increased up to 56% amid COVID-19 compared to the previous year, whereas relative consumption of products and services that cannot be consumed at home (e.g., fuel, transportation, personal care services, restaurant) has decreased up to 51%. Similarly, after controlling for the corresponding factors, online shopping has increased up to 21%, while its expenditure share has increased by up to 16% compared to the pre-COVID-19 period.


Non-technical Summary
Consumption within the U.S. is reduced significantly due to the coronavirus disease 2019 (COVID-19). This reduction has been through both the direct impact of COVID-19 due to lockdowns or social distancing and its indirect impact through financial market shocks and their effects on the real economy. The nationwide consumption fall in the U.S. is also evident widely across sectors (except for grocery) and especially for products purchased through offline (rather than online) shopping.

However, such a nationwide observation can easily suppress valuable information on consumption patterns coming from more disaggregated areas as their effects may cancel each other out during the aggregation process. For example, when zip codes are considered, spending on a particular sector may increase in one zip code, whereas it may decrease in another, resulting in no significant impact at the aggregate level. Therefore, using data from more disaggregated areas is important to understand the changes in consumption patterns amid COVID-19.

Based on this motivation, this paper investigates sector-level as well as online versus offline consumption patterns within the U.S. by using monthly zip-code level data (covering 16 U.S. cities) on credit card transactions for local commercial purchases. The main strategy is to identify common factors across zip codes representing sector-level or online versus offline consumption patterns at the U.S. national level that do not suffer from an aggregation problem. This is achieved by estimating sector-time fixed effects or shopping channel-time fixed effects in the monthly zip-code level data, where factors that are zip-code and time specific as well as those that are zip-code and sector specific are controlled for.

The results based on the sector-level data show that consumption of products and services that can be consumed at home (e.g., grocery, pharmacy, home maintenance) have increased by up to 56% during the lockdown period starting from March 2020, whereas consumption of products and services that cannot be consumed at home (e.g., fuel, transportation, personal care services, restaurant) have decreased by up to 51%.


This result is analogous to the one that has been used to explain the reduction in economic activity, unemployment or social distancing experience by workers' ability of working from home. The difference in this paper is that it is consuming at home that can be connected to the sectoral heterogeneity in consumption changes amid COVID-19.


The results based on online versus offline shopping show that online shopping has increased by up to 21%, while its expenditure share has increased by up to 16% compared to the pre-COVID-19 period.


The corresponding academic paper by Hakan Yilmazkuday has been accepted for publication at Journal of Risk and Financial Management.
 
The working paper version is available here.


Sunday, May 17, 2020

COVID-19 and Exchange Rates: Spillover Effects of U.S. Monetary Policy


COVID-19 and Exchange Rates: Spillover Effects of U.S. Monetary Policy


One sentence summary: The spillover effects of U.S. monetary policy have been effective only for certain countries that can be explained by the disease outbreak channel.

The corresponding academic paper by Hakan Yilmazkuday has been accepted for publication at Atlantic Economic Journal.

The working paper version is available here.

 
Abstract
This paper investigates the spillover effects of U.S. monetary policy on exchange rates of 11 emerging markets and 12 advanced economies during the pre-COVID-19 versus COVID-19 periods. The investigation is achieved by a structural vector autoregression model, where year-on-year changes in weekly measures of economic activity, exchange rates and policy rates are used. The empirical results suggest evidence for the spillover effects of U.S. monetary policy for several countries during the pre-COVID-19 period, whereas they have been effective only for certain countries during the COVID-19 period that can be explained by the disease outbreak channel. Important policy implications follow.
 

Non-technical Summary
The Coronavirus Disease 2019 (COVID-19) has reduced economic activity in an unprecedented way. This reduction has resulted in extraordinary unemployment levels around the world. Accordingly, several central banks, including the U.S. Federal Reserve System, have reacted to the economic developments due to COVID-19 by reducing their policy rates.

This paper investigates the spillover effects of U.S. monetary policy on exchange rates during the pre-COVID-19 versus COVID-19 periods. The main objective is to investigate whether these spillover effects have been effective during the COVID-19 period. Country-specific analyses are conducted for 11 emerging markets and 12 advanced economies, where monetary policies of these countries are also controlled for. The formal investigation is by a structural vector autoregression (SVAR) model, where year-on-year growth rates of weekly measures of economic activity, exchange rates, and policy rates are used during the pre-COVID-19 versus COVID-19 periods.

The spillover effects of U.S. monetary policy are investigated by accepting the U.S. economy as an exogenous block to be used in the SVAR estimation of each country. We focus on the cumulative impulse response of exchange rates (constructed as appreciation of currencies) to a negative shock on the (shadow) federal funds rate. We also investigate the contribution of (shadow) federal funds rate to the exchange rate volatility of domestic currencies based on the forecast error variance decomposition.
 
The empirical results suggest that there is evidence for the spillover effects of U.S. monetary policy for almost all countries during the during the pre-COVID-19 period, whereas they have been effective for only certain countries during the COVID-19 period. When we further investigate the reasons behind the heterogeneity across countries, we show that only the exchange rates of countries that were successful in fighting against COVID-19 were subject to the spillover effects of U.S. monetary policy during the COVID-19 period
 
 
The corresponding academic paper by Hakan Yilmazkuday has been accepted for publication at Atlantic Economic Journal.

The working paper version is available here.


Monday, May 11, 2020

COVID-19 and Monetary Policy with Zero Bounds: A Cross-Country Investigation


COVID-19 and Monetary Policy with Zero Bounds: A Cross-Country Investigation


One sentence summary: Emerging markets or countries without a zero bound on their interest rates were able to reduce their interest rates as a reaction to reduced economic activity and to the volatility in their exchange rates, whereas advanced economies or countries with a zero bound on their interest rates were not.

The corresponding academic paper by Hakan Yilmazkuday has been accepted for publication at Finance Research Letters.
 
The working paper version is here.

 
Abstract
Using daily data on policy rates from 28 advanced economies and 32 emerging markets, this paper investigates the monetary policy reaction function of central banks during the Coronavirus Disease 2019 (COVID-19). Since inflation is mostly silent during this period, the reaction function focuses on the changes in economic activity measured by daily Google mobility data and the depreciation rate of currencies. The panel estimation takes the question of causality seriously by using a difference-in-difference approach with weekly changes in variables, where time fixed effects, country fixed effects as well as the country-specific effects of the 100th COVID-19 case in each country are controlled for. The results show that emerging markets or countries without a zero bound on their interest rates were able to reduce their interest rates as a reaction to reduced economic activity and to the volatility in their exchange rates, whereas advanced economies or countries with a zero bound on their interest rates were not. Several policy implications follow for countries with a zero lower bound on their interest rates amid COVID-19.


Non-technical Summary
Several governments have issued stay-at-home orders around the world to fight against the Coronavirus disease 2019 (COVID-19) pandemic. Even essential sectors (e.g., food production) have experienced shutdowns due to workers diagnosed with COVID-19, because COVID-19 spreads mainly through person-to-person contact. These developments have created unprecedented unemployment rates around the world. Accordingly, several central banks have reacted by changing their policy rates to help their economies.

This paper investigates the monetary policy reaction function of central banks for 28 advanced economies and 32 emerging markets during the COVID-19 pandemic covering the daily period between February 15th, 2020 and May 2nd, 2020. Since inflation is mostly silent during this period, the reaction function focuses on the changes in economic activity measured by daily Google mobility data and the depreciation rate of currencies. A panel estimation is achieved by taking the question of causality seriously, where a difference-in-difference approach is used with weekly changes in variables. In this panel estimation, time fixed effects, country fixed effects as well as the country-specific effects of the 100th COVID-19 case in each country are all controlled for.

The variables are summarized below for advanced economies versus emerging markets.


Similarly, they are summarized below for countries with and without zero bounds on their interest rates, where countries with zero bound on interest rates are defined as those that have a policy rate below 0.5% as of May 2nd, 2020 (although a continuous measure through threshold interest rates is used in formal estimations).


As is evident, although the reduction in economic activity starting from March 2020 is very similar across country groups, the policy rate changes and depreciation rates are highly different. This suggests that alternative country groups might have reacted differently to the reduction in their economic activity.

Due to the significantly positive coefficients in monetary policy reaction functions, given that economic activity is reduced during the sample period, the panel empirical results based on the pooled sample suggest that central banks have reacted by reducing their policy rates. The panel empirical results also suggest that central banks have reacted to sustain the stability of their currencies, potentially to keep future inflation under control.

In additional analyses, countries have been categorized as advanced economies versus emerging markets as well as those with and without zero bounds on their interest rates. The corresponding panel estimation results show that emerging markets or countries without a zero bound on their interest rates were able to reduce their interest rates as a reaction to reduced economic activity and to the volatility in their exchange rates, whereas advanced economies or countries with a zero bound on their interest rates were not.
 
Several policy implications follow for countries with a zero lower bound on their interest rates during COVID-19. These include considering alternative policies such as unconventional monetary or fiscal policies as they have been shown to work better for countries with a zero lower bound on their interest rates. However, as the ability of these countries to conduct fiscal is limited by their access to credit markets, countries should pay more attention to their credit rating if they would like to be successful in fighting against the economic implications of COVID-19.


The corresponding academic paper by Hakan Yilmazkuday has been accepted for publication at Finance Research Letters.
 
The working paper version is here.


Monday, April 27, 2020

Welfare Costs of Travel Reductions within the U.S. due to COVID-19


Welfare Costs of Travel Reductions within the U.S. due to COVID-19


One sentence summary: The cumulative welfare costs of reduced travel with respect to January 20th, 2020 is about 11% as of April 19th, 2020 within the U.S., with a range between 7% and 16% across counties.

The corresponding academic paper by Hakan Yilmazkuday has been accepted for publication at Regional Science, Policy and Practice.
 
The corresponding working paper is available here.

 
Abstract
Using daily county-level travel data within the U.S., this paper investigates the welfare costs of travel reductions due to COVID-19 for the period between January 20th and September 5th, 2020. Welfare of individuals (related to their travel) is measured by their inter-county and intra-county travel, where travel costs are measured by the corresponding distance measures. Important transport policy implications follow regarding how policy makers can act to mitigate welfare costs of travel reductions without worsening the COVID-19 spread.


Non-technical Summary
After the World Health Organization declared the coronavirus disease 2019 (COVID-19) as a pandemic on March 11th, 2020 and the U.S. federal government declared National Emergency on March 13th, 2020 due to COVID-19, individuals in the U.S. started traveling less due to health concerns, lockdowns or stay-at-home orders. Although these travel reductions are useful to fight against COVID-19, they also result in welfare losses for individuals who get utility out of traveling for leisure, social or recreational purposes.

Using daily county-level travel data from the U.S., this paper investigates the welfare costs of reduced travel during the COVID-19 pandemic. For motivational purposes, a simple model is introduced to measure the welfare of individuals depending on their travel behavior. Travel costs are measured by the distance across (or within) U.S. counties. The implications of the model are estimated by using daily data on inter-county and intra-county travel between January 20th and September 5th, 2020. 
 
The corresponding results show that the negative effects of distance on travel have rapidly increased during the first half of April 2020, after which a gradual recovery has been experienced until June 2020 across U.S. counties.
 

These distance effects are further connected to the welfare of individuals by using the implications of the model. In technical terms, this is achieved by connecting the time-varying effects of distance on travel across (or within) the U.S. counties to the welfare of individuals by taking the total derivative of their utility measured by their travel.


The corresponding results suggest that the cumulative welfare costs of reduced travel with respect to January 20th, 2020 has reached its highest value of about 11% on April 19th, 2020 for the U.S., with a range between 7% and 16% across U.S. counties.
 

When the heterogeneity across U.S. counties on April 19th, 2020 is further investigated, it is shown that initial travel patterns of counties (during the month of January) is correlated with the cumulative welfare costs of reduced travel, suggesting that more-traveling counties in the pre-COVID-19 era have experienced higher welfare costs.
 
When we investigate the political reasons behind the highest cumulative reduction in welfare specifically on April 19th, 2020, we observe that it is the day when the highest portion of U.S. counties have experienced stay-at-home orders. 
 
 
As the estimated welfare losses in this paper (due to traveling less for leisure, social or recreational purposes) are large and significant, there are several implications for policy makers regarding how they can act to mitigate these welfare losses without worsening the COVID-19 spread. Possible policy recommendations include learning from historical experiences and transport policy actions during earlier pandemics, preparing legal and regulatory frameworks as well as supporting guidelines and contingency plans for traveling, providing safety for the health and economic conditions of the transport personnel, sharing information not only with the public but also among different layers of government, adjusting operating times or the travel mode, or hiring contract tracers to detect exposed travelers quickly. Considering these policy recommendations would not only mitigate the spread of COVID-19 but also let individuals travel with fewer concerns, which is essential to reduce the severity of the welfare costs of travel reductions estimated in this paper.


The corresponding academic paper by Hakan Yilmazkuday has been accepted for publication at Regional Science, Policy and Practice.
 
The corresponding working paper is available here.


Sunday, April 19, 2020

COVID-19 and Unequal Social Distancing across Demographic Groups


COVID-19 and Unequal Social Distancing across Demographic Groups


One sentence summary: Blacks and Hispanics, as well as lower-income and lower-educated people, were able to experience relatively less social distancing amid COVID-19.

The corresponding academic paper by Hakan Yilmazkuday has been accepted for publication at Regional Science, Policy and Practice.

The corresponding working paper is available here.
 
Abstract
This paper analyzes whether social distancing experienced by alternative demographic groups within the U.S. has been different amid COVID-19. The formal investigation is achieved by using daily state-level mobility data from the U.S. covering information on the demographic categories of income, education and race/ethnicity. The results show that social distancing have been experienced more by higher-income, higher-educated or Asian people after the declaration of National Emergency on March 13th, 2020. Since alternative demographic groups were subject to alternative employment opportunities during this period (e.g., due to being able to work from home), redistributive effects of COVID-19 are implied that require demographic-group specific policies.


Non-technical Summary
The coronavirus disease 2019 (COVID-19) has been declared as a pandemic by the World Health Organization on March 11th, 2020, whereas the U.S. has declared National Emergency about it on March 13th, 2020. Accordingly, several governments around the world have implemented stay-at-home orders as COVID-19 spreads mainly through person-to-person contact. Although some of these orders were based on demographic characteristics such as age groups due to the way that COVID-19 affects people of alternative ages, in practice, knowledge and attitudes have been different across other demographic characteristics such as income, education, race, ethnicity, gender, occupation, population, and place of current residence. Since economic activity is highly related to mobility, these developments imply potential redistributive effects of COVID-19 across demographic groups that require the attention of policy makers.

Based on this motivation, this paper analyzes how alternative demographic groups have experienced social distancing with the U.S. amid COVID-19. Daily state-level mobility data for social interactions covering the period between January 21th, 2020 and June 26th, 2020 are utilized for alternative demographic categories of income, education and race/ethnicity. The descriptive statistics for the median U.S. state suggest that social distancing have been experienced more by higher-income, higher-educated or Asian people after the declaration of National Emergency on March 13th, 2020. This observation is mostly due to these groups having relatively higher levels of social interaction (with respect to other groups) before the declaration of National Emergency, because all groups have experienced similar levels of social interaction after the declaration.


Since the descriptive statistics for the median U.S. state do not control for any state-specific development such as state-level policies or the health system of the state that may change over time, a formal investigation is also achieved by using a panel regression analysis. The objective of this regression is to capture how different demographic groups have achieved social distancing after controlling for factors that are state-time specific (e.g., state-level policies on certain days) or group-state specific (e.g., higher-income individuals in certain states socially interacting differently from other higher-income individuals in other states).


The results of the formal investigation support the descriptive statistics by showing that social distancing has been experienced more by higher-income, higher-educated or Asian people compared to other demographic groups after the declaration of National Emergency. In particular, the social distancing experienced by the highest-income group after the declaration of National Emergency has been about 31% and 32% more than the first and the second income quartiles, respectively, and 25% more than the third income quartile. The social distancing experienced by the highest-education group after the declaration of National Emergency has been about 53% more than the first education quartile, 46% more than the second education quartile, and 34% more than the third education quartile. The social distancing experienced by the Asian race after the declaration of National Emergency has been about 20% more than blacks and Hispanics, and 18% more than whites.


Important policy implications follow, especially when it is considered that higher-educated, higher-income or Asian people were able to work at home and maintain employment during COVID-19 due to their occupations, whereas lower-educated workers, blacks or Hispanics were not able to work at home due to their occupations and thus became unemployed. In particular, although higher-income, higher-educated or Asian people have experienced higher social distancing after the declaration of National Emergency, since social interaction levels are similar across demographic groups after the declaration, redistributive effects of COVID-19 are implied due to different demographic groups being or not being able to work at home. Accordingly, demographic-group specific policies are required to reduce not only the overall economic impact of COVID-19 but also the corresponding inequality across demographic groups.


The corresponding academic paper by Hakan Yilmazkuday has been accepted for publication at Regional Science, Policy and Practice.

The corresponding working paper is available here.


Wednesday, April 8, 2020

Stay-at-Home Works to Fight Against COVID-19: International Evidence from Google Mobility Data


Stay-at-Home Works to Fight Against COVID-19: International Evidence from Google Mobility Data


One sentence summary: Stay-at-home works to fight against COVID-19.

The corresponding academic paper by Hakan Yilmazkuday has been accepted for publication at Journal of Human Behavior in the Social Environment.
 
The working paper version is available here.

 
Abstract
Daily Google mobility data covering 130 countries over the period between February 15th, 2020 and May 2nd, 2020 suggest that less mobility is associated with lower COVID-19 cases and deaths. This observation is formally tested by using a difference-in-difference design, where country-fixed effects, time-fixed effects as well as the country-specific timing of the 100th COVID-19 case are controlled for. The results suggest that 1% of a weekly increase in being at residential places leads into about 70 less weekly COVID-19 cases and about 7 less weekly COVID-19 deaths, whereas 1% of a weekly decrease in visits to transit stations leads into about 33 less weekly COVID-19 cases and about 4 less weekly COVID-19 deaths, on average across countries. Similarly, 1% of a weekly reduction in visits to retail & recreation results in about 25 less weekly COVID-19 cases and about 3 less weekly COVID-19 deaths, or 1% of a weekly reduction in visits to workplaces results in about 18 less weekly COVID-19 cases and about 2 less weekly COVID-19 deaths.


Non-technical Summary
Coronavirus disease 2019 (COVID-19) has been declared as a pandemic on March 11th, 2020 by the World Health Organization. Due to the high number of COVID-19 cases and deaths, several countries reacted to this pandemic by issuing stay-at-home orders, because COVID-19 spreads mainly through person-to-person contact. Nevertheless, as shown in the figure below, countries have alternative changes in their mobility over time based on Google mobility data.


In particular, across countries, as of May 2nd, 2020, the reduction in visits to retail & recreation ranges between 21% and 95%, that of grocery & pharmacy ranges between 8% and 98%, that of parks ranges between 12% and 95%, that of transit stations ranges between 27% and 100%, and that of workplaces ranges between 14% and 92%, whereas the increase in being at residential places ranges between 8% and 55%, all with respect to the baseline determined by Google.

This paper investigates the relationship between country-specific changes in mobility and the corresponding COVID-19 cases/deaths. This is achieved by using daily data on COVID-19 cases and deaths as well as Google mobility data covering 130 countries around the world for the period between February 15th, 2020 and May 2nd, 2020. Descriptive statistics suggest that both COVID-19 cases and deaths are lower in countries with less mobility.

The formal investigation is achieved by using a difference-in-difference design, where weekly changes in COVID-19 cases or deaths are regressed on weekly changes in mobility. After controlling for county-fixed effects, time-fixed effects, and country-specific timing of the 100th COVID-19 case, the results suggest that 1% of a weekly increase in being at residential places leads into about 70 less weekly COVID-19 cases and about 7 less weekly COVID-19 deaths, whereas 1% of a weekly decrease in visits to transit stations leads into about 33 less weekly COVID-19 cases and about 4 less weekly COVID-19 deaths, on average across countries.


Similarly, 1% of a weekly reduction in visits to retail & recreation results in about 25 less weekly COVID-19 cases and about 3 less weekly COVID-19 deaths, or 1% of a weekly reduction in visits to workplaces results in about 18 less weekly COVID-19 cases and about 2 less weekly COVID-19 deaths. Finally, 1% of a weekly reduction in visits to grocery & pharmacy or parks results in about 1 less weekly COVID-19 death, although the effects on COVID-19 cases are statistically insignificant.


The corresponding academic paper by Hakan Yilmazkuday has been accepted for publication at Journal of Human Behavior in the Social Environment.
 
The working paper version is available here.


Saturday, April 4, 2020

COVID-19 Spread and Inter-County Travel: Daily Evidence from the U.S.


COVID-19 Spread and Inter-County Travel: Daily Evidence from the U.S.


One sentence summary: Lower inter-county travel is associated with lower COVID-19 cases and deaths.

The corresponding academic paper by Hakan Yilmazkuday has been accepted for publication at Transportation Research Interdisciplinary Perspectives.

The corresponding working paper is available here.
 
 
Abstract
Daily data at the U.S. county level suggest that coronavirus disease 2019 (COVID-19) cases and deaths are lower in counties where a higher share of people have stayed in the same county (or travelled less to other counties). This observation is tested formally by using a difference-in-difference design controlling for county-fixed effects and time-fixed effects, where weekly changes in COVID-19 cases or deaths are regressed on weekly changes in the share of people who have stayed in the same county during the previous 14 days. A counterfactual analysis based on the formal estimation results suggests that staying in the same county has the potential of reducing total weekly COVID-19 cases and deaths in the U.S. as much as by 139,503 and by 23,445, respectively.


Non-technical Summary
As of September 2nd, 2020, the number of people who have lost their lives in the U.S. due to the coronavirus disease 2019 (COVID-19) has reached 181,129, whereas the number of cases has reached 5,909,266. Since COVID-19 spreads mainly through person-to-person contact, different layers of government in the U.S. reacted to this development by implementing travel restrictions, both internationally and domestically, which is similar to other countries or other time periods. However, these restrictions do not cover the U.S. in a nationwide way, since the federal government has left such policy decisions to local governments.
 
Based on this background, this paper investigates whether inter-county travel within the U.S. has any implications for COVID-19 cases or deaths. This is achieved by using U.S. daily data at the county level covering the period between January 21th, 2020 and September 2nd, 2020. Inter-county travel is measured by using data from smartphone devices. Descriptive statistics suggest that both COVID-19 cases and deaths are lower in counties where a higher share of people have stayed in the same county (or a fewer share of people have travelled across counties) during the previous 14 days.

Since descriptive statistics cannot control for any county-specific characteristics or time-specific changes that are common across counties, a formal investigation is achieved by using a difference-in-difference design, where county-fixed effects and time-fixed effects are controlled for. The estimation results suggest that if a person lives in a county where the average person has travelled less compared to the previous week, it is better for this person to stay in her county to reduce the possibility of catching COVID-19 as her county has lower COVID-19 cases or deaths due to other people in that county travelling less. 
 

The estimation results are further used to answer the following hypothetical question based on a counterfactual analysis: What would happen to the number of COVID-19 cases and deaths in each county if all people would stay in the same county? 
 
 
The results suggest that staying in the same county has the potential of reducing total weekly COVID-19 cases and deaths in the U.S. as much as by 139,503 and by 23,445, respectively. At the county level, staying in the same county has the potential of reducing COVID-19 cases between 2 and 209 across counties, and it has the potential of reducing county-specific COVID-19 deaths up to 35. It is implied that staying in the same county (i.e., travelling less across counties) would help fighting against COVID-19. 
 
 
The corresponding academic paper by Hakan Yilmazkuday is available as a working paper here.


Wednesday, April 1, 2020

COVID-19 and Daily Oil Price Pass-Through


COVID-19 and Daily Oil Price Pass-Through


One sentence summary: Following an increase in the number of U.S. COVID-19 cases, there is evidence for complete pass-through (incomplete pass-through) of crude oil prices into the U.S. gasoline spot (retail) prices.

The corresponding academic paper by Hakan Yilmazkuday has been accepted for publication at Energy Research Letters.
 
The working paper version is here.

 
Abstract
This paper investigates the (crude) oil price pass-through into gasoline spot and gasoline retail prices in the U.S. due to the effects of coronavirus disease 2019 (COVID-19). The investigation is achieved by using daily data in a structural vector autoregression framework. The oil price pass-through is measured as the cumulative impulse response of gasoline spot or gasoline retail prices divided by the cumulative impulse response of oil prices, both following a percentage change in total number of the U.S. COVID-19 cases. The results suggest evidence for complete pass-through of oil prices into gasoline spot prices, whereas the corresponding pass-through into gasoline retail prices is about 29 percent in the long run.

 
Non-technical Summary
Total number of coronavirus disease 2019 (COVID-19) cases in the U.S. has been recorded as more than 30 million as of April 2021 according to the Centers for Disease Control and Prevention. This number is reflected as a substantial drop in the economic activity in the U.S. as individuals have voluntarily started experiencing social distancing to fight against COVID-19 and several layers of government in the U.S. have further implemented stay-at-home orders starting from March 2020. This reduction in economic activity has also resulted in higher unemployment rates and thus lower overall expenditure of individuals. Accordingly, the demand for both crude oil and gasoline has been reduced dramatically, whereas supply shocks due to the OPEC disagreement starting from March 2020 have further contributed to the turmoil of crude oil prices around the globe.

Based on this period of strong volatility due to the COVID-19 crisis, this paper investigates the pass-through of crude oil prices into the U.S. gasoline spot and gasoline retail prices. This is achieved by using the implications of a structural vector autoregression (SVAR) model, where weekly percentage changes of daily endogenous variables are used for the crude oil prices, gasoline spot prices, and gasoline retail prices. Weekly percentage changes in daily total number of COVID-19 cases in the U.S. enter as an exogenous variable in this framework. The pass-through of crude oil prices into gasoline prices is measured by the cumulative impulse response of gasoline spot or gasoline retail prices divided by the cumulative response of crude oil prices, both following a percentage change in the U.S. COVID-19 cases.


The empirical results based on the crude oil price data of "Brent Spot Price FOB (Dollars per Barrel)" provide evidence for complete pass-through of crude oil prices into gasoline spot prices. In particular, 1% of a weekly increase in daily crude oil prices results in about 1.1% of a weekly increase in daily gasoline spot prices in the U.S. after one week, 1% after one month, and again 1% after two months.


The results also suggest that the pass-through of oil prices into gasoline retail prices in the U.S. is incomplete, both in the short run and the long run. Specifically, 1% of a weekly increase in daily crude oil prices results in about 0.15% of a weekly increase in daily gasoline retail prices after one week, 0.29% after one month, and again 0.29% after two months. The empirical results are highly similar when the crude oil price data of "Cushing, OK WTI Spot Price FOB (Dollars per Barrel)" are used.

 
The corresponding academic paper by Hakan Yilmazkuday has been accepted for publication at Energy Research Letters.
 
The working paper version is here.


Monday, March 23, 2020

Unequal Unemployment Effects of COVID-19 and Monetary Policy across U.S. States


Unequal Unemployment Effects of COVID-19 and Monetary Policy across U.S. States


One sentence summary: There is evidence for unequal unemployment effects of COVID-19 and the corresponding national monetary policy across U.S. states. 
 
The corresponding academic paper by Hakan Yilmazkuday has been accepted for publication at Journal of Behavioral Economics for Policy.

The corresponding working paper is available here.

 
Abstract
This paper shows that daily Google trends can be used as an alternative to conventional U.S. data (with alternative frequencies) on unemployment, interest rates, inflation and coronavirus disease 2019 (COVID-19). This information is used to investigate the effects of COVID-19 and the corresponding monetary policy on the U.S. unemployment, both nationally and across U.S. states, by using a structural vector autoregression model. Historical decomposition analyses show that the U.S. unemployment is mostly explained by COVID-19, whereas the contribution of monetary policy is almost none. An investigation based on the U.S. states further suggests that COVID-19 and the corresponding monetary policy conducted based on nationwide economic developments have resulted in unequal changes in state-level unemployment rates, suggesting evidence for distributive effects of national monetary policy.
 

Non-technical Summary
The weekly unemployment claims were about 281,000 in the week ending March 14th, 2020 according to the U.S. Department of Labor, reaching its highest level since September 2nd, 2017. In the corresponding news release, the U.S. Department of Labor announced the following statement:
"During the week ending March 14, the increase in initial claims are clearly attributable to impacts from the COVID-19 virus. A number of states specifically cited COVID-19 related layoffs, while many states reported increased layoffs in service related industries broadly and in the accommodation and food services industries specifically, as well as in the transportation and warehousing industry, whether COVID-19 was identified directly or not."
where the Coronavirus Disease 2019 (COVID-19) was shown to be responsible. Even after five months, weekly unemployment claims were about 1,106,000 in the week ending August 15th, 2020 when the U.S. Department of Labor further announced the following statement:
"The COVID-19 virus continues to impact the number of initial claims and insured unemployment."
where the continuous severity of COVID-19 effects on the U.S. unemployment can still be observed.

This paper investigates the dynamic relationship between COVID-19 and the U.S. unemployment by considering the effects of U.S. monetary policy, both nationally and across U.S. states. Since this investigation requires data on unemployment, interest rates, inflation and COVID-19, which are only available in alternative (e.g., daily, weekly, monthly) frequencies, this paper uses Google search queries capturing the desired variables on a daily basis. The sample covers the daily period between January 1st, 2020 and August 24th, 2020.

Before moving to the formal investigation, it is first shown that daily Google trends can be used as an alternative to conventional U.S. data (with alternative frequencies) on unemployment, interest rates, inflation and developments related to COVID-19.
 
 
The nationwide formal analysis for the U.S. is achieved by employing a four-variable structural vector autoregression (SVAR) model, where daily data on COVID-19, unemployment, interest rates, and inflation are used. The results show that COVID-19 has increased unemployment both in the long-run and the short-run, while monetary authorities have reacted to COVID-19 by reducing the interest rate, which has helped reducing the unemployment rate in a minor way. 
 

Historical decomposition analyses further show that the U.S. unemployment is mostly explained by COVID-19, whereas the contribution of monetary policy is almost none.


The implications for the U.S. state-level unemployment are further investigated by including a fifth variable in SVAR model, which is daily unemployment obtained for 50 states and the District of Columbia. The results based on individual state-level analyses suggest evidence for unequal unemployment effects of COVID-19; e.g., COVID-19 has negatively affected unemployment in the state of Washington by about four times of that in New Hampshire. 
 

The results also suggest evidence for unequal unemployment effects of national monetary policy across U.S. states. In particular, accommodative (national) monetary policy has helped reducing unemployment only in certain states, whereas unemployment in certain others have not benefited at all from it.

The corresponding academic paper by Hakan Yilmazkuday has been accepted for publication at Journal of Behavioral Economics for Policy.

The corresponding working paper is available here.


Monday, March 16, 2020

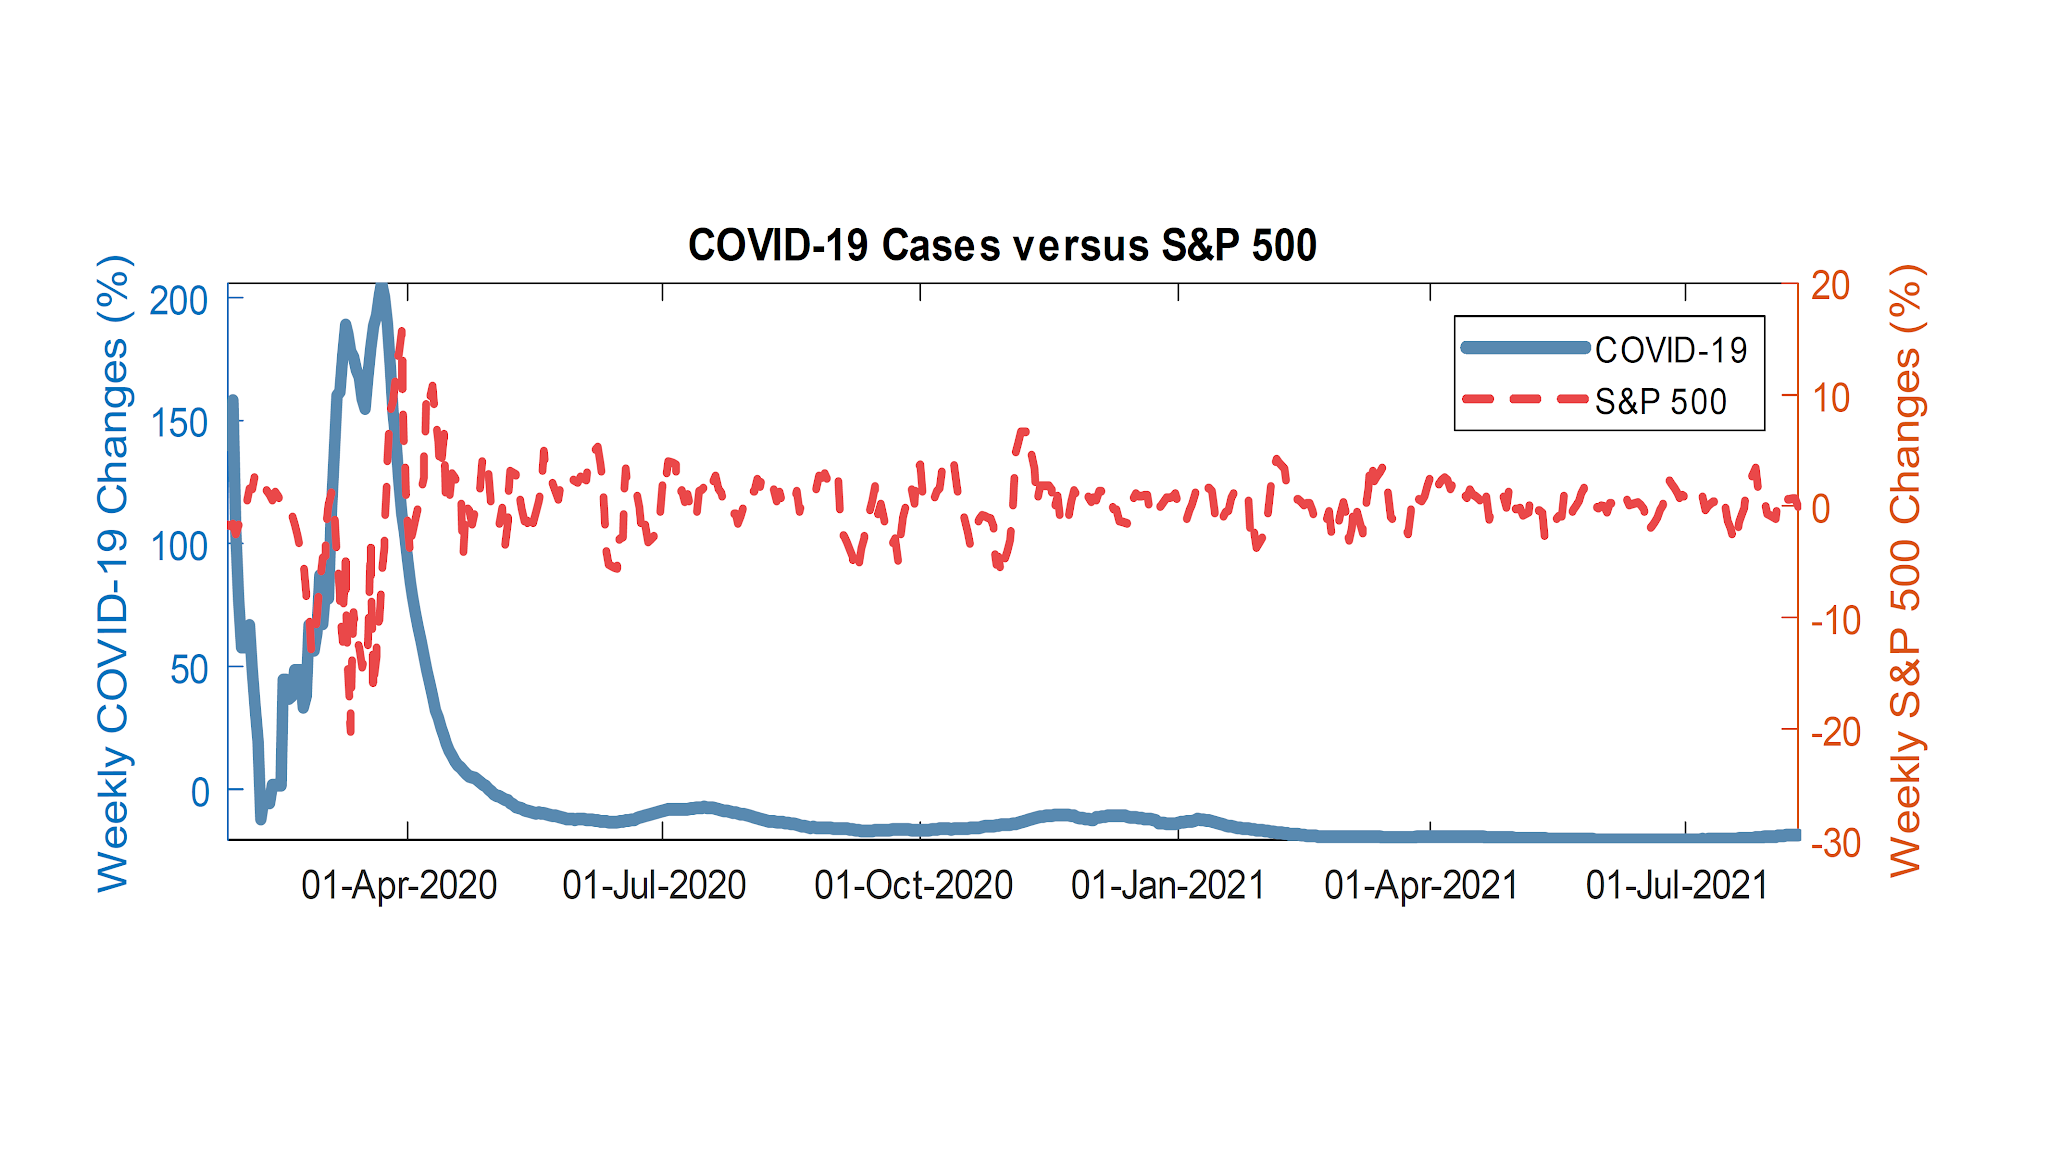
COVID-19 Effects on the S&P 500 Index


COVID-19 Effects on the S&P 500 Index


One sentence summary: Having 1% of an increase in cumulative daily COVID-19 cases in the U.S. results in about 0.01% of a cumulative reduction in the S&P 500 Index after one day and about 0.03% of a reduction after one week.

The corresponding academic paper by Hakan Yilmazkuday has been accepted for publication at Applied Economics Letters.
 
The working paper version is available here.

 
Abstract
This paper investigates the effects of the coronavirus disease 2019 (COVID-19) cases in the U.S. on the S&P 500 Index using daily data covering the period between January 21st, 2020 and August 10th, 2021. The investigation is achieved by using a structural vector autoregression model, where a measure of the global economic activity and the spread between 10-year treasury constant maturity and the federal funds rate are also included. The empirical results suggest that having 1% of an increase in cumulative daily COVID-19 cases in the U.S. results in about 0.01% of a cumulative reduction in the S&P 500 Index after one day and about 0.03% of a reduction after one week. Historical decomposition of the S&P 500 Index further suggests that the negative effects of COVID-19 cases in the U.S. on the S&P 500 Index have been mostly observed during March 2020.
 

Non-technical Summary
The coronavirus pandemic 2019 (COVID-19) has killed 618,363 people in the U.S. as of August 10th, 2021, with corresponding COVID-19 cases of 36,152,620. This has created a significant turmoil not only in the global economic activity but also in financial markets around the world. This turmoil can best be observed by the Standard & Poor's (S&P) 500 Index, which is the benchmark financial and economic indicator in the U.S. and fell from about 3,386.15 on February 19th, 2020 to about 2,237.40 on March 23rd, 2020, corresponding to about 41% of a fall, although it achieved a great recovery with record braking values such as 4,436.75 on August 10th, 2021.


This paper attempts to understand the reasons behind the volatility in the S&P 500 Index during COVID-19 by using daily data between January 21st, 2020 (when the first COVID-19 case was reported in the U.S.) and August 10th, 2021 (the latest day available when this paper was written). As this volatility in the S&P 500 Index may be due to COVID-19 or any other factor (e.g., the economic activity or interest rates), a formal analysis is required to identify the causal effects of COVID-19 on the S&P 500 Index. Such an investigation is achieved in this paper by using a structural vector autoregression (SVAR) model, where the S&P 500 Index is used together with a measure of the global economic activity and the spread between 10-year treasury constant maturity and the federal funds rate in the U.S. Since COVID-19 is an exogenous shock, percentage changes in cumulative daily COVID-19 cases in the U.S. are included as an exogenous variable in this framework.

Following several early or recent studies in the literature, the global economic activity is measured by the Baltic Exchange Dry Index (BDI). This is a daily published index by the Baltic Exchange in London, and it reflects the shipping costs (due to using vessels of various sizes covering multiple maritime routes) regarding the transportation of raw commodities (e.g., grain, coal, iron ore, copper). Since these shipping costs are determined by the supply and demand forces in the global market, they are robust to any speculative manipulation or any government intervention by construction. The spread between 10-year treasury constant maturity and the federal funds rate in the U.S. not only reflects the term premium (between long-run and short-run interest rates) but also the future expectations in the U.S. economy.

The empirical results suggest that having 1% of an increase in cumulative daily COVID-19 cases in the U.S. results in about 0.01% of a cumulative reduction in the S&P 500 Index after one day and about 0.03% of a reduction after one week.


Historical decomposition of the S&P 500 Index further suggests that the negative effects of COVID-19 cases in the U.S. on the S&P 500 Index have been mostly observed during March 2020. 


The corresponding academic paper by Hakan Yilmazkuday has been accepted for publication at Applied Economics Letters.
 
The working paper version is available here.